
What is technical analysis?
Technical analysis is a way of predicting stock movement based on historical market data. It is used to evaluate investments and identify trading opportunities. It often incorporates insights from market psychology, behavioral economics, and quantitative analysis to carefully examine past performance to help predict future market behavior.
The two most important indicators in technical analysis are price
movement and volume. As a trading discipline, it can be applied to any
security with historical trading data, such as stocks, futures,
commodities, fixed-income and currencies. The focus of technical
analysis is price patterns and trends rather than external drivers
such as news events or intrinsic factors such as company
fundamentals.
Though some experts view technical analysis as simply the study of supply and demand forces as reflected in the market price movements of a security, the core underlying principle is that the market price and the stock's chart trends reflect all the available and necessary information that could impact the market.
What is the difference between fundamental and technical
analysis?
Technical analysis is often compared to fundamental analysis, another
methodology. Fundamental analysis evaluates stocks based on industry
and business fundamentals such as growth trends and a company's
prospects using financial metrics like price-to-sales (P/S) and
price-to-earnings (P/E) ratios.
While technical analysis focuses on charts and price patterns,
fundamental analysis looks at earnings, dividends, and financial
statements, as well as other indicators. Fundamental analysts see a
connection between price movements and all things related to the
economy — earnings, the actions of competitors, and important news
events.
Fundamental analysis is largely concerned with the intrinsic value of
a stock. It focuses on critical economic and financial indicators.
This is distinct from technical analysis, which examines chart
statistics like shifts in price or trading volume.
In some instances, technical analysts aren't particularly concerned
about the company's purpose and are simply focused on analyzing a
stock's price action. And while technical analysis lends itself to a
faster investing pace, fundamental analysis has a longer decision
timeline because of the extra due diligence required.
How can I use technical analysis?
Self-directed investors can apply technical analysis to any stock or
ETF price chart that tracks price changes over different time frames.
These range from shifts within a single day that can run from minutes
to hours, called intraday trading, to extended periods that last days,
months or years.
Technical analysis can be used the following ways:
- Determine if a security is bullish or bearish.
- Establish short and long-term trading opportunities
- Fix an entry or exit point on a security and then use support or resistance levels to set a sell or buy limit order
- Can be used for short selling
- Help validate or confirm a buy or sell decision made using fundamental analysis
How does technical analysis work?
Technical analysis functions by examining security price fluctuations
and volumes over time. It's important to remember that no single
indicator provides a complete and accurate picture. Typically, a
technical investor will combine several indicators before evaluating a
purchase or sale. Below is a list of the indicators most used by
technical investors.
-
Charts and volume are the first and basic steps for
technical analysis
- Trend analysis
- Support and resistance indicators
- Moving averages
- Classic patterns
- Oscillator
What is chart analysis?
Chart analysis helps determine the prevailing trend of a security. It uses different types of charts to convey different kinds of information. Charts help traders make informed decisions and visually represent asset price, and volume changes over different periods of time. There are many types to select from such as a Candlestick chart or a Bar charts (high/low/close/open). Most direct brokerage firms will provide several different views to present the data.
Volume goes hand in hand with chart analysis because it is a valuable
source of information for validating bullish or bearish signals.
Therefore, it is important to always take volume into account at all
times when analyzing charts, as it often represents the strength of a
technical move. The higher volume, the higher the probability that the
price change will continue to fluctuate.
What is a candlestick chart?
Candlestick charts are a standard method to show price movement on a chart. Each candlestick indicates price changes within a fixed period. In a day chart, each candlestick entry will show price fluctuations for the day, while a four-hour chart will graph changes in value over multiple four-hour periods.
Example of a candlestick chart
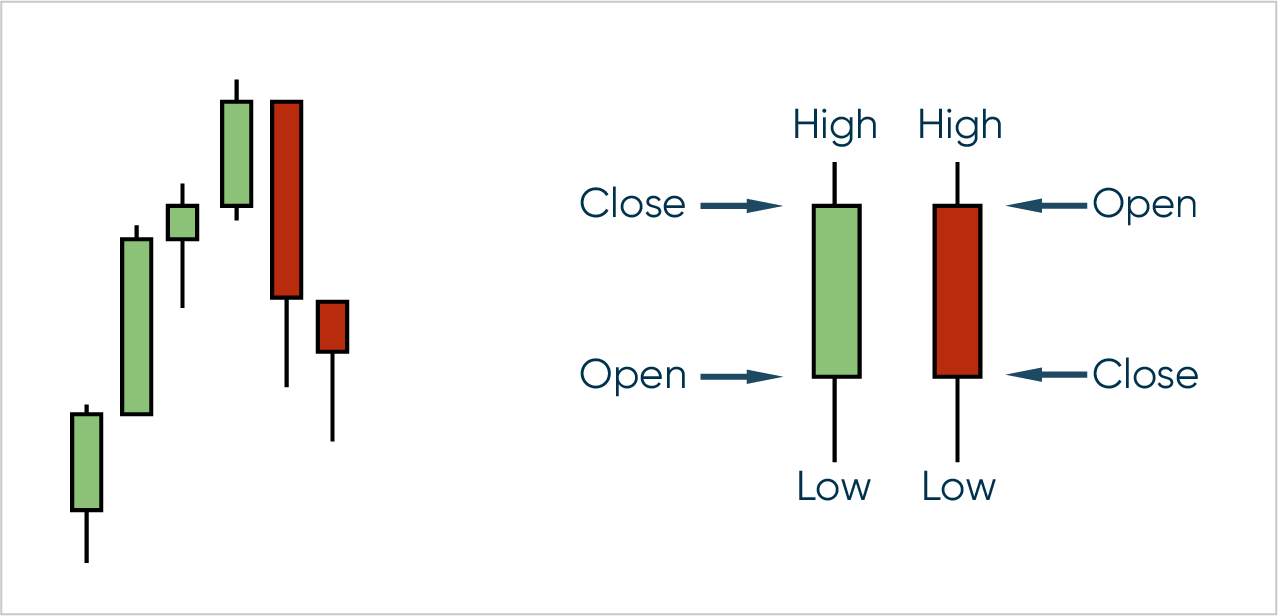
Each candlestick entry shows the asset's high value and the low value
within that period. If the candlestick's body is green, the price
trend is going up. The opening value of the asset is indicated at the
bottom of the candlestick body, and the closing price for that slice
of time is displayed at the top.
A red candlestick body indicates a descending valuation with the
opening price at the higher or top value and the closing price at the
bottom of the candlestick. The wick, or thin lines, extending out from
the center of the body of a green or red candlestick, indicate the
high and low price extremes for the asset during that same
timeframe.
What is trend analysis?
Within the financial industry there is a common saying: the trend is
your friend. This saying relates to the concept of momentum and that a
security will want to continue moving in the same direction (upward or
downward) and you shouldn’t fight it. Keeping that in mind, before
making an investment decision on a stock, it is essential to define
the stock's trend. By doing so, we can ensure that we invest in the
direction of the trend. A moving trend has a higher probability of
continuing.
Upward trend line:
A positively sloping line drawn by connecting two or more ascending troughs on the price curve. This line indicates that demand (buyers) is or has been stronger than supply (sellers). As long as the stock price remains above the trend line, the trend is valid. A break of the price across the trend line indicates weak demand, and may therefore correspond to a bearish signal.
Downward trend line:
Negatively sloping line drawn by connecting two or more descending vertices on the price curve. This line indicates that supply (sellers) is stronger than demand (buyers). As long as the stock price remains below the trend line, the trend is valid. A price break through the trend line indicates an increase in demand, and may therefore correspond to a bullish signal.
Trend analysis
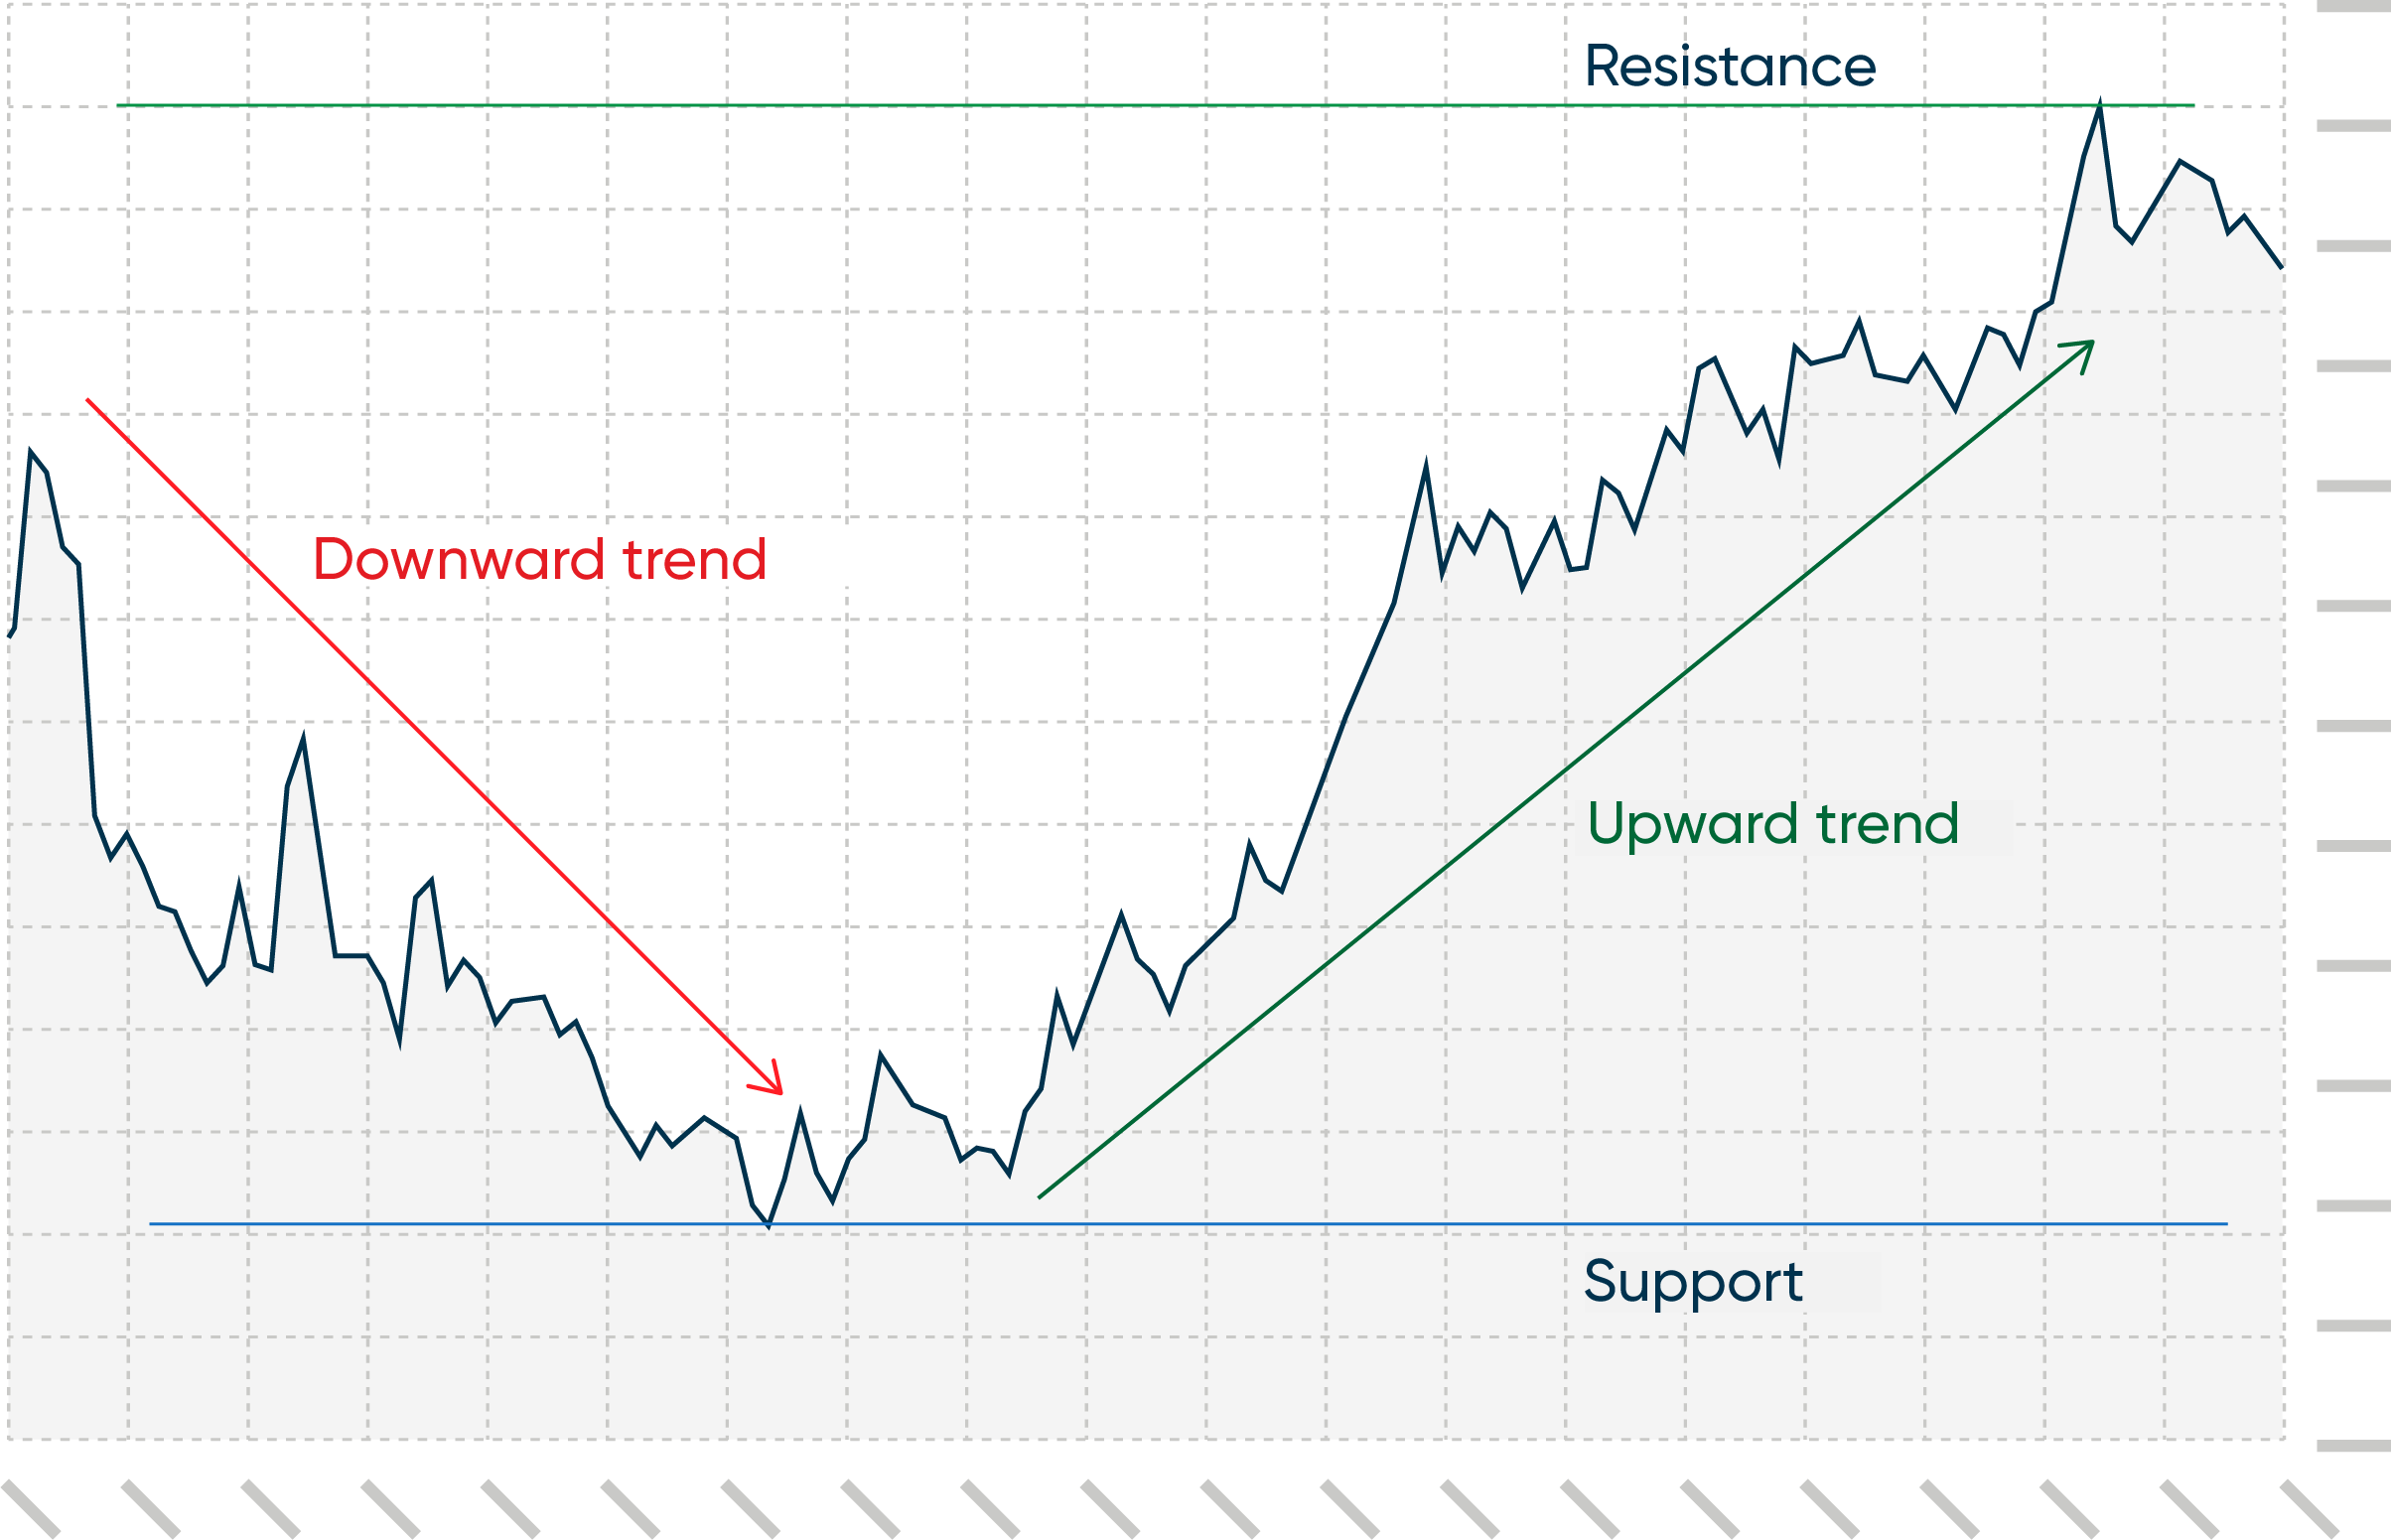
What are support and resistance levels?
Support
and resistance levels show the point at which an asset price
rebounds upwards or downwards. As a stock's price trends downwards, it
will hit a low point at which the price becomes attractive to
potential buyers. At this point, demand increases and prices start
going up. Over time this rebound point can be plotted as a straight
line called the support level.
A resistance level is the exact opposite of a support level. As an
asset increases in value, it will reach a point where demand outstrips
supply. However, as the price increases, traders may determine that
they are too high, have met a perceived target price or are
overvalued. The consequence is a decrease in demand and a reduction in
the value of the asset. Plotted over time, this line or zone is the
resistance level.
Many investors can also use those price levels in order to set
purchase or sales prices for their securities. Other investors will
monitor support and resistance levels to see when they are crossed,
used with other indicators and volume it could be a sign that the
price of the security will continue to increase or decrease.
Technical analysts use support or resistance lines as predictors of
price thresholds. But these indicators are open to a great deal of
interpretation because a security might not rebound up or down at
those same levels in the future.
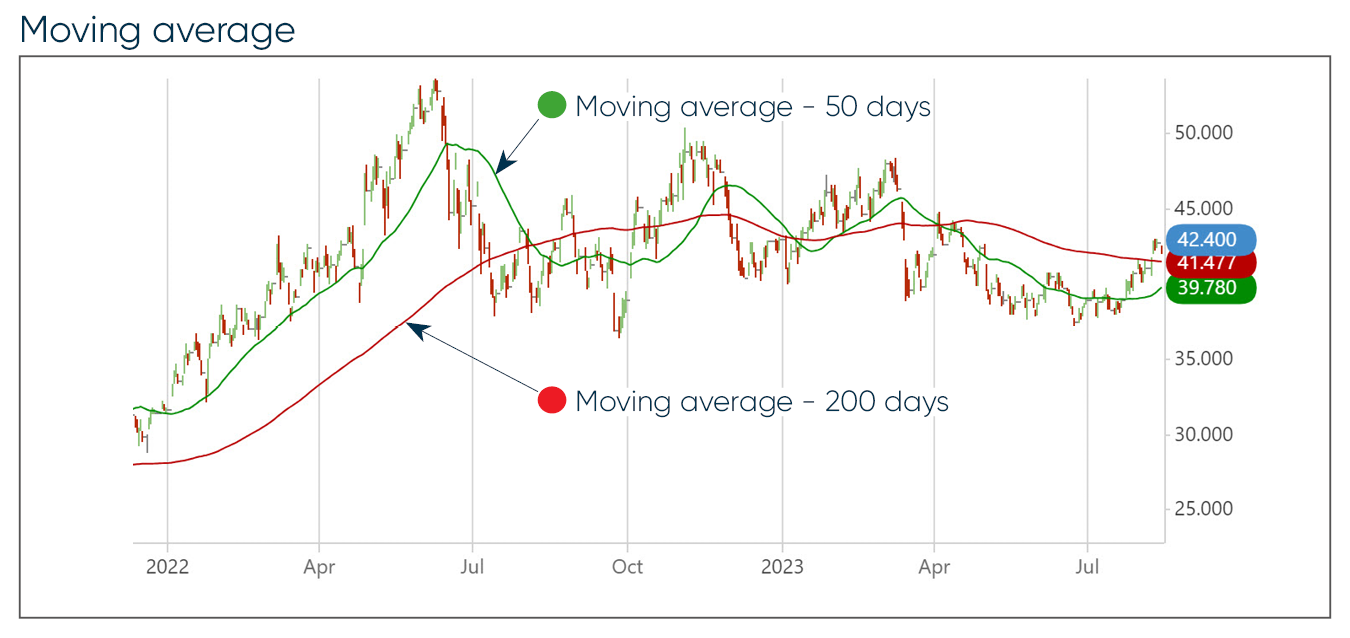
What are moving averages?
The moving
average is a type of statistical average used to determine the
average value of a security over a fixed period of time. It is
calculated by adding up the closing value at each time frame and
dividing the total by the number of time frames. For example, the
moving average over five days would involve adding up the total at
each day's close and dividing by five.
Moving averages are used as trend indicators and help traders
establish support and resistance zones for a stock. When a share price
crosses a moving average, it is considered a buy or sell signal
because it indicates a shift in the directional momentum of the
security.
The most frequently used moving averages are the 20, 50- and 200-days
moving averages which are suitable for longer-term investors.
Moving average
What are classic patterns?
Classic patterns are a term used to refer to a group of patterns that
typically have a longer-term horizon which can be bullish or bearish
and have distinct price swings such that the price swings form
distinctive patterns.
The patterns will consist of some combination of trendlines, support
and resistance levels. Unlike other types of technical analysis,
classic patterns are the only ones that provide the investor with a
target price. There are numerous patterns that exist and that are
followed looked for by technical analysts. One of the most well-known
is the bullish head and shoulder pattern.
What is a head and shoulder pattern?
The head and shoulder pattern is an easy-to-spot pattern in technical
analysis. It is an initial peak followed by an upward trend that peaks
to a second higher level called the head. It then takes a short
downward trajectory peaking again below the head level, before
continuing in a price descent. Visually, it appears as three peaks on
a graph, with the middle one higher than the two peaks on either
side.
Though formations are rarely perfect, the standard head and shoulders
pattern describes a chart formation that predicts a bullish-to-bearish
trend reversal. Despite its limitations, it is considered one of the
most reliable trend reversal patterns for traders who use technical
analysis.
What are oscillators?
Oscillators are another widely used group of technical analysis chart
indicators that can aid a trader in determining if a security is in an
overbought or oversold condition. They are usually range bound and
will oscillate between them and they can draw attention to a possible
change in the price direction of the security. Oscillators tend to
work best when the security’s price has become range bound.
Two of the most well-known oscillators are the Relative Strength index and the Moving average convergence divergence analysis which will be elaborated below.
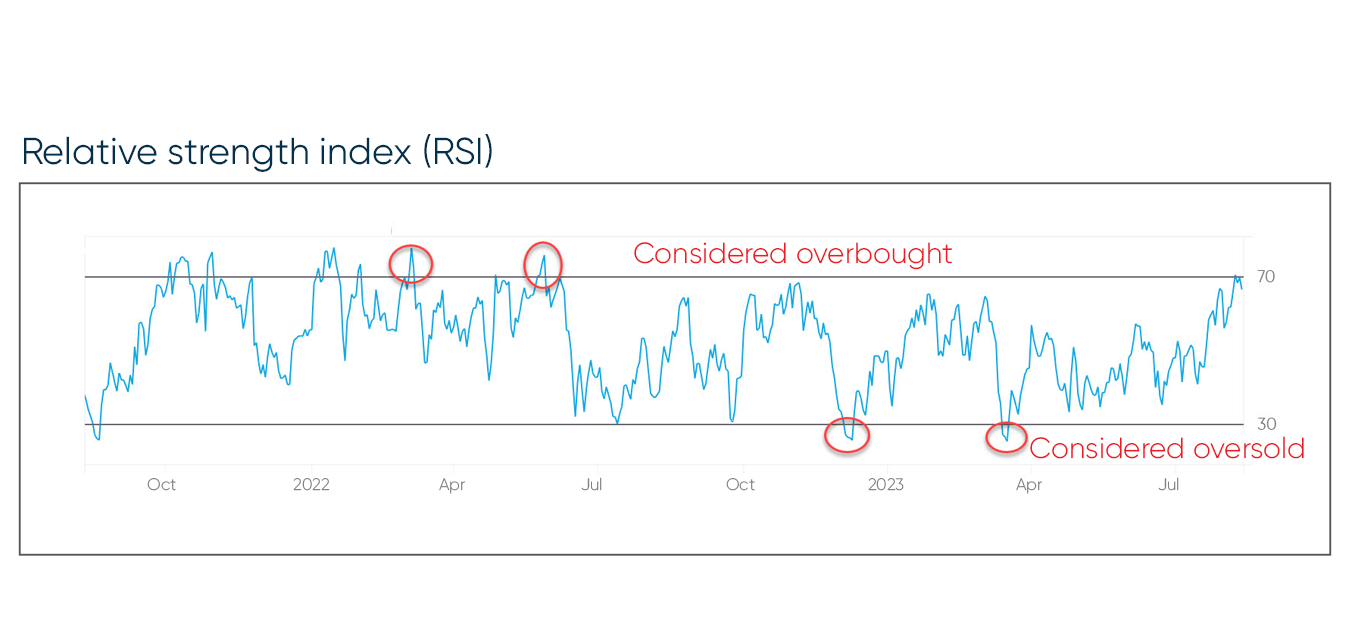
Relative strength index (RSI)
The relative strength index (RSI) is a stock momentum indicator.10 The RSI allows traders to assess a stock movement's strength and identify trends shifts. The index compares a security's strength on days prices go up to its strength when prices go down.
Operating on a scale ranging from 0 to 100, if an RSI drops below 30,
the share is considered oversold; if it goes up above 70, it is
considered overbought. A stock is oversold when technical analysts
feel it is trading at a lower-than-expected price. A stock is
overbought when it trades above its intrinsic value and is priced
higher than expected.
Although the RSI can be useful to active investors trying to take
advantage of short-term price fluctuations, it is less reliable in
trending markets than in trading ranges. Most traders understand that
the signal given by the RSI in strong upward or downward trends can
often be false.
Relative strength index (RSI)
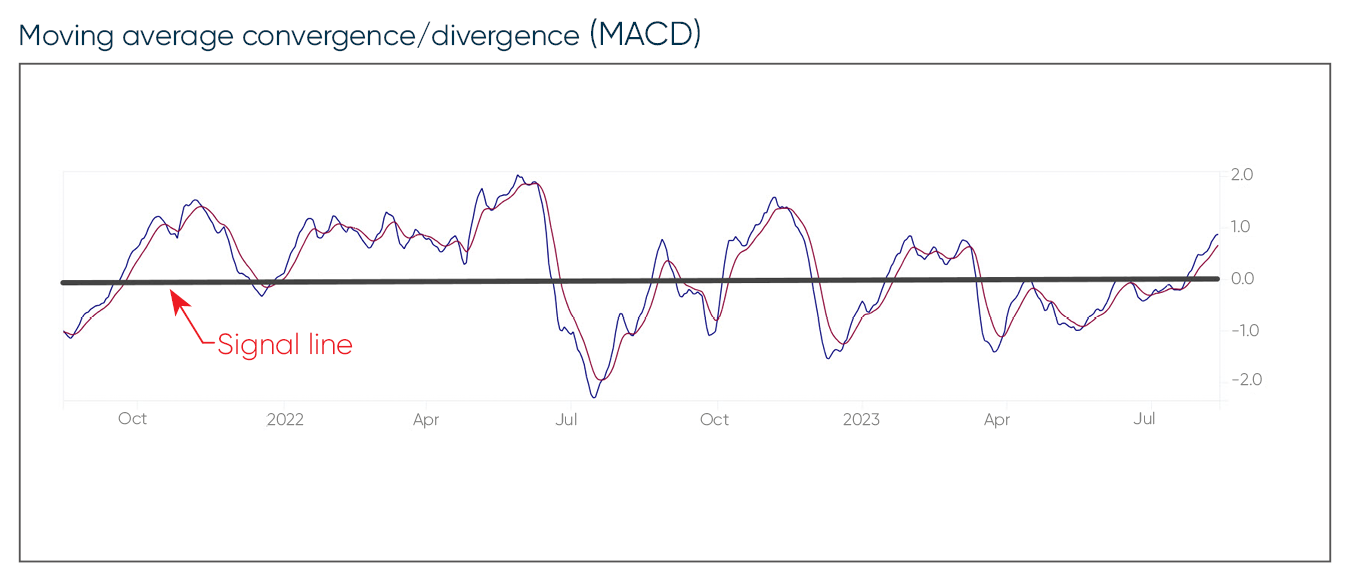
Moving Average Convergence Divergence (MACD) analysis
The Moving Average Convergence Divergence (MACD) is an indicator that is used to identify and confirm trend reversals in a stock's movement. A MACD compares a 26-period exponential moving average price with a 12-period exponential average of the same price. If the MACD line moves above the signal line, it indicates a bullish trend; an investor using this indicator would buy the security. If the MACD line drops below the signal line, this indicates a negative trend, in which case an investor might sell.
Differences between the MACD line and the signal line also indicate divergences. A divergence occurs when the share price and the MACD line no longer follow the same trend. For example, a share price could continue to rise to new highs while the indicator shows that those highs are getting progressively lower.
Active traders often use the MACD indicator because it allows them to see changes in the momentum of a trend easily. Nevertheless, traders should also confirm momentum or trend changes using other technical indicators too, such as RSI and candlestick charts.
MACD indicator
Discover how to optimize your trading strategies with Technical Insight
Best practices for technical analysis
Like all investment strategies, technical analysis may be relatively
quick and efficient, but it has limitations. No technical indicator
allows you to predict the future with certainty, and it is important
to remember not to make a trading decision based on the analysis of
only one indicator.
Though technical analysis is useful to traders focusing on the short
term, fundamental analysis tends to be better for long-term investing.
As a general rule, the degree of confidence in the direction of a
security goes up when many different signals point in the same
direction.
Ultimately, using a combination of both fundamental analysis and technical analysis is the best way to reach an informed determination of the value of a particular security.
Predicting the future is an inexact science at best. Even if you do
your homework no single investment strategy is foolproof. But
independent investors with more precise knowledge and better tools
will be able to make more informed investment decisions.
At the same time, it is important to remember that investing involves
a level of risk. Markets can be volatile, and things can change
unexpectedly. National Bank Direct Brokerage can help you grow your
wealth as an independent investor.
Discover technical insights. Find out more about technical analysis on the NBDB website.
Support your investment decisions with fundamental analysis using our tools
Discover our tools
Key Takeaways
- Technical analysis relies on historical data about a security's price and trading volume changes to evaluate the quality of the asset.
- Analytical time frames can run from hours to years.
- Technical analysis is best suited to short-term investment strategies and is often used by day traders.
- Correlating multiple technical indicators is essential when deciding to buy or sell a security.
- Technical analysis is often used alongside fundamental analysis to make investment decisions.