How Do You Calculate a Moving Average?
First of all, you should know that moving averages are a type of statistical average that is used to determine the average value over a series of data. In technical analysis, the moving average is obtained by adding the closing price of the stock during a defined number of periods and then dividing this sum by the same number of periods.
- Example of calculation behind a simple moving average (SMA) over 5
periods:
($3.25 + $3.30 + $3.35 + $3.30 + $3.35) / 5 = $3.31
Note that there is also an exponential moving average (EMA) and the formula behind it places more importance on the most recent data. This method of calculation ensures that the EMA reacts more strongly to the latest fluctuations in the share price.
It is also important to understand that, unlike the VWAP indicator (volume weighted average price indicator), simple and exponential moving averages rely solely on price changes and do not take into account trading volume.
What Does the Period of a Moving Average Mean?
Depending on the time scale of the chart, a moving average over 20 periods can be calculated based on 20 periods of 5 minutes or 20 periods of one hour. As such, you can use moving averages both in a daily chart (each period representing a day) and in a per-minute intra-session chart.
For technical analysis of share price movements, the three most commonly used basic moving averages are the 20 SMA, the 50 SMA and the 200 SMA, meaning measurements over 20, 50 or 200 periods. Using moving averages over different periods allows you to get buy and sell signals that vary depending on the sensitivity of the moving average. The longer the period, the less reactive the moving average is to fluctuations in the share price.
The Moving Average as a Trend Indicator
A moving average is used to view the average value of the share price over a predetermined period. Used in a technical analysis context, moving averages are trend indicators that also act as support or resistance zones for the share price. Indeed, it is considered a buy or sell signal when the share price crosses a moving average, indicating a change in directional momentum.
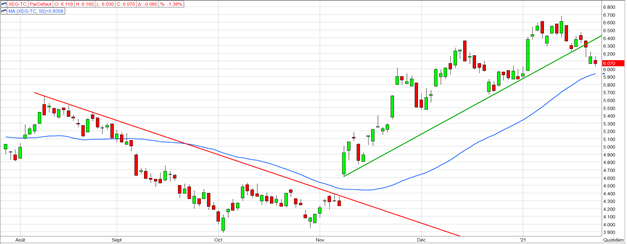
In the daily chart below, you can see that when the share price is below the blue line, representing an SMA over 50 periods, the stock is in a downward trend. Conversely, when the price rises above the blue line, the stock is beginning an upward trend. The higher the number of periods used to calculate the moving average, the more it points to a long-term trend change.

Source : Market-Q
Crossing Moving Averages
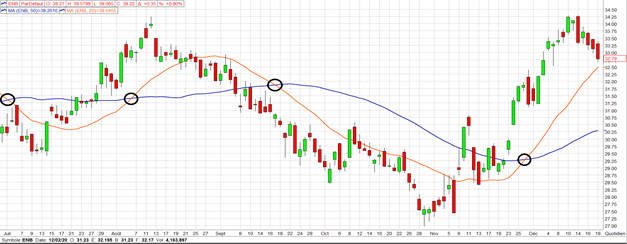
By using moving averages with different periods on the same chart, you can generate buy and sell signals that confirm the direction of the trend. When crossing two moving averages, it is the direction of the SMA with a lower number of periods that indicates the direction that the share price should take.

Source : Market-Q
In the chart above, you can see an example of using crossing moving averages to look for signals. When the 20 SMA (red line) crosses the 50 SMA (blue line) heading downward, it is a bearish momentum signal, and when the 20 SMA crosses upward, it is a buy signal. For crossovers, the key is looking at the direction of the more reactive of the two moving averages.
Combining Indicators to Make Better Decisions
Moving averages are used in technical analysis by self-directed investors because they allow for a better visualization of the trend in a stock’s price. By using them, you will be able to more easily identify the momentum and then avoid taking positions that run counter to the trend. Obviously, it’s important to keep in mind that there is no foolproof analysis tool, which is why it is highly recommended to combine moving averages with other indicators to obtain several convergent signals.
Support your investment decisions with technical analysis using our tools
Key takeaways:
- Moving averages are a type of statistical average that is used to determine the average value over a series of data.
- In technical analysis, the moving average is obtained by adding the closing price of the stock during a defined number of periods and then dividing this sum by the same number of periods.
- A moving average is used to view the average value of the share price over a predetermined period.
- For technical analysis of share price movements, the three most commonly used basic moving averages are the 20 SMA, the 50 SMA and the 200 SMA, meaning measurements over 20, 50 or 200 periods.
- Using moving averages over different periods allows you to get buy and sell signals that vary depending on the sensitivity of the moving average.
Author biography
Alexandre Demers has been an active investor since 2013 and is the founder and president of Traders 360 Inc. He has also authored the e-book “Investir à contre-courant” (Investing against the grain) and hosts the “Finance 360” podcast available free on Spotify and Apple Podcast. His goal is to make stock trading more democratic and educate the public at large about the possibilities of self-managed investments.
For more details, go to www.traders360.ca
The above article was written by Traders 360, an independent external firm partnered with National Bank Direct Brokerage.
