
What Are Support and Resistance Levels?
Support/resistance levels are prices at which the share price usually rebounds upward or downward. Based on the theory of “market memory,” these price levels remain relevant over time and retain their role for support or resistance in the future.
- Support: the level from which the share price tends to rise due to strong demand as a result of a higher concentration of buyers.
- Resistance: the level from which the price tends to fall due to greater supply, i.e., there is stronger pressure from sellers.
Note that the strength of a support or resistance level varies depending on the number of times they have been tested and how long they have been around. In other words, we can expect that a resistance level that has been reached several times and has extended over several weeks should be more difficult to overcome than one that emerges over a period of a few minutes.
Identifying Important Price Levels
To identify the support level, simply draw a line at the price level where the share price seems to rebound upward. The objective here is to connect at least two troughs to form a horizontal line that will serve to identify the “floor” area that supports the share price. Conversely, to identify resistance, simply draw a horizontal line connecting two or more peaks to determine the area where the share price seems to hit a ceiling.
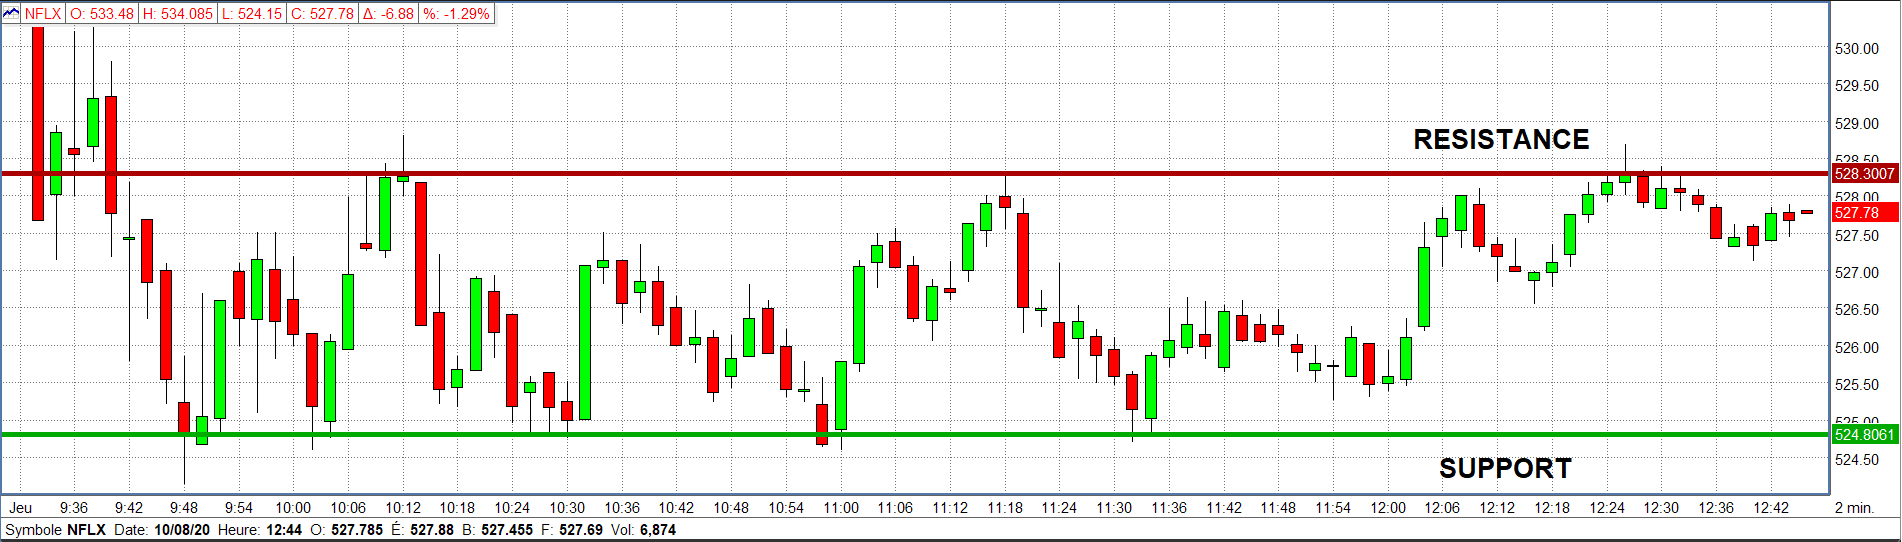
As we can see in the image above, the share price seems to bounce back from the two areas that have been plotted in the price chart.
It is important to know that when the price of a stock crosses a resistance line, this price level turns into a support zone, as long as the price remains above that value. Conversely, when a support level is broken and the share price moves below that line, that price level now acts as a resistance level.
How Can We Use This Information?
1. As a self-directed investor, you can use support and resistance levels to improve the timing of your stock purchases and sales. Indeed, by adopting a rebound-oriented purchasing strategy, an investor can decide to buy once the share price has bounced from the support line and then sell at a price as close as possible to the resistance zone. This approach consists of trading within a corridor formed by a support and resistance boundary called a trading range.
2. Another potentially attractive approach for investors is to take a position after a break in a resistance level, called a breakout. The logic behind this strategy is that when the share price manages to overcome a significant resistance level, we can expect the price to start a sharp rise until it reaches the next resistance zone. This way, you can determine at what price it could be attractive to buy the stock to take advantage of strong bullish momentum.
3. Lastly, you can also use support and resistance zones to help you manage risk. Based on these price levels, you can determine your target gain as well as the price at which you would be prepared to sell at a loss. For example, you could place a stop-loss order below the support line to allow you to limit your maximum loss. The reasoning behind this strategy is that when the share price breaks through the support line, it indicates downward pressure, so it is highly likely that the price will continue to fall until the next support level.
Conclusion
To wrap up, support and resistance are essential concepts to understand when analyzing the charts of publicly listed securities. Since the share price is influenced by investor sentiment, the psychological price levels that appear in the chart should be considered if you are trying to optimize your buy or sell timing. Ultimately, support and resistance levels are additional tools that can assist you in your journey as a self-directed investor and allow you to make wiser investment decisions.
Author biography: Alexandre Demers has been an active investor since 2013 and is the founder and president of Traders 360 Inc. He has also authored the e-book “Investir à contre-courant” (Investing against the grain) and hosts the “Finance 360” podcast available free on Spotify and Apple Podcast. His goal is to make stock trading more democratic and educate the public at large about the possibilities of self-managed investments.
More details at: www.traders360.ca
The above article was written by Traders 360, an independent
external firm partnered with National Bank Direct Brokerage.