
In this article, we will cover the MACD indicator to help you better understand how it works and how to use it.
Definition
MACD is an acronym for Moving Average Convergence Divergence. This indicator is used in technical analysis to attempt to identify and confirm trend reversals. Note that the MACD uses exponential moving averages (EMAs) because the calculation method for this type of moving average places more importance on recent data and results in the indicator potentially being more reactive to changes.
Dissecting the MACD
*Source: Market-Q
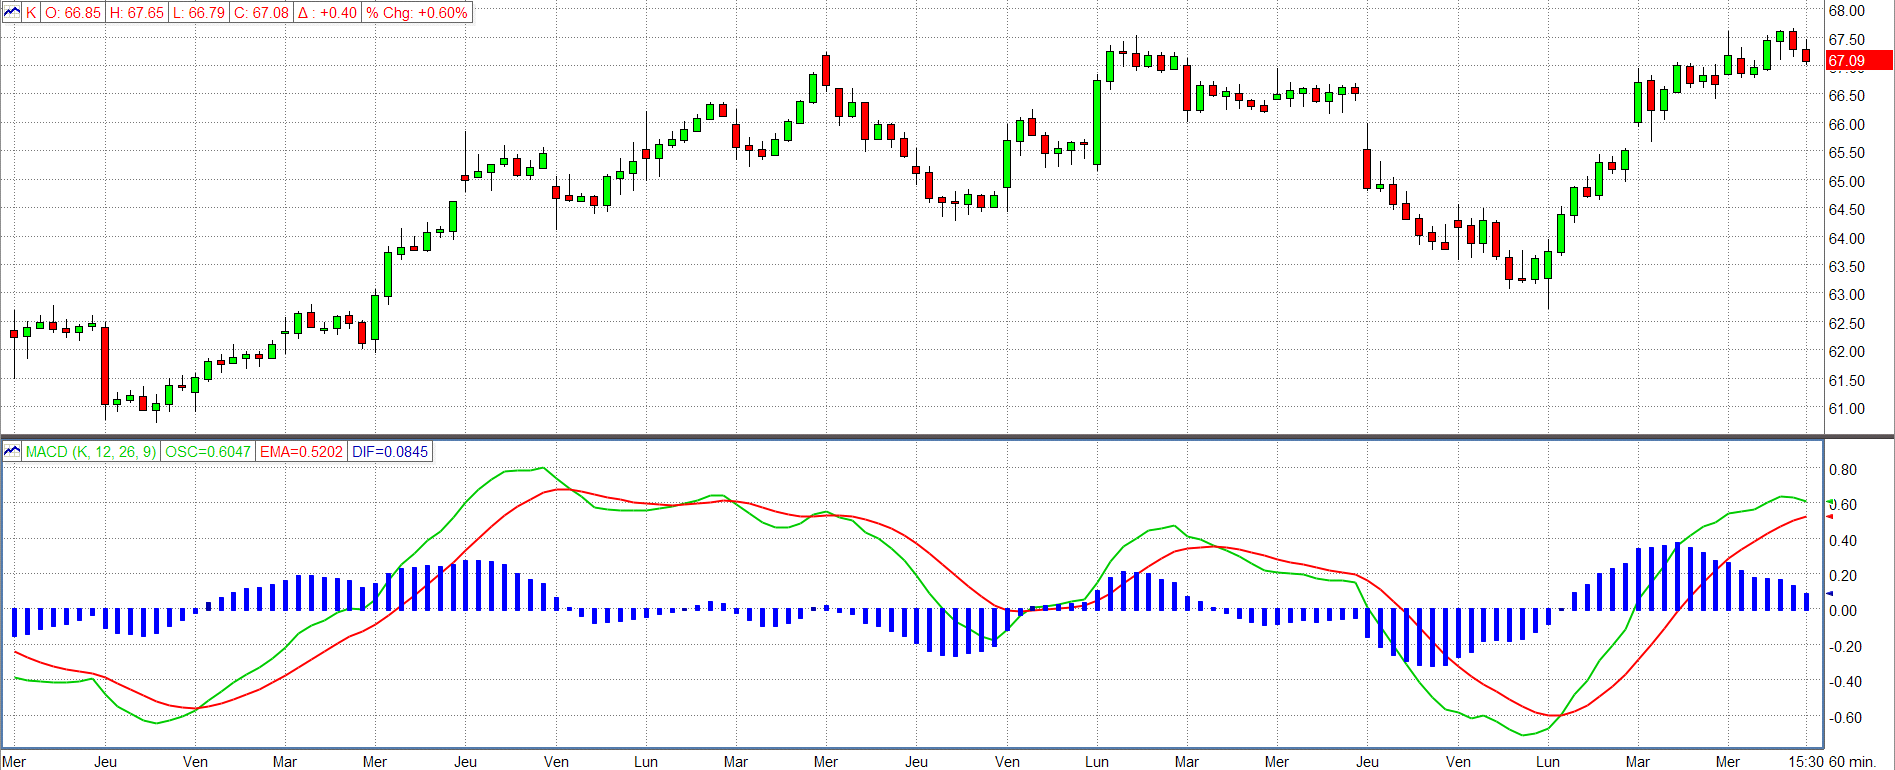
As you can see, this technical indicator is made up of several components. Let’s take a look at the various elements:
- The green line (MACD): Calculated based on the difference between 2 exponential moving averages. By default, this is an EMA over 26 periods and an EMA over 12 periods.
- The red line (Signal): This displays a 9-period EMA of the MACD. This line is used to generate buy and sell signals.
- The blue bar chart: This allows you to visually represent the difference between the MACD line and its signal line as well as when they cross each other.
Interpreting the indicator
Intersections of moving averages
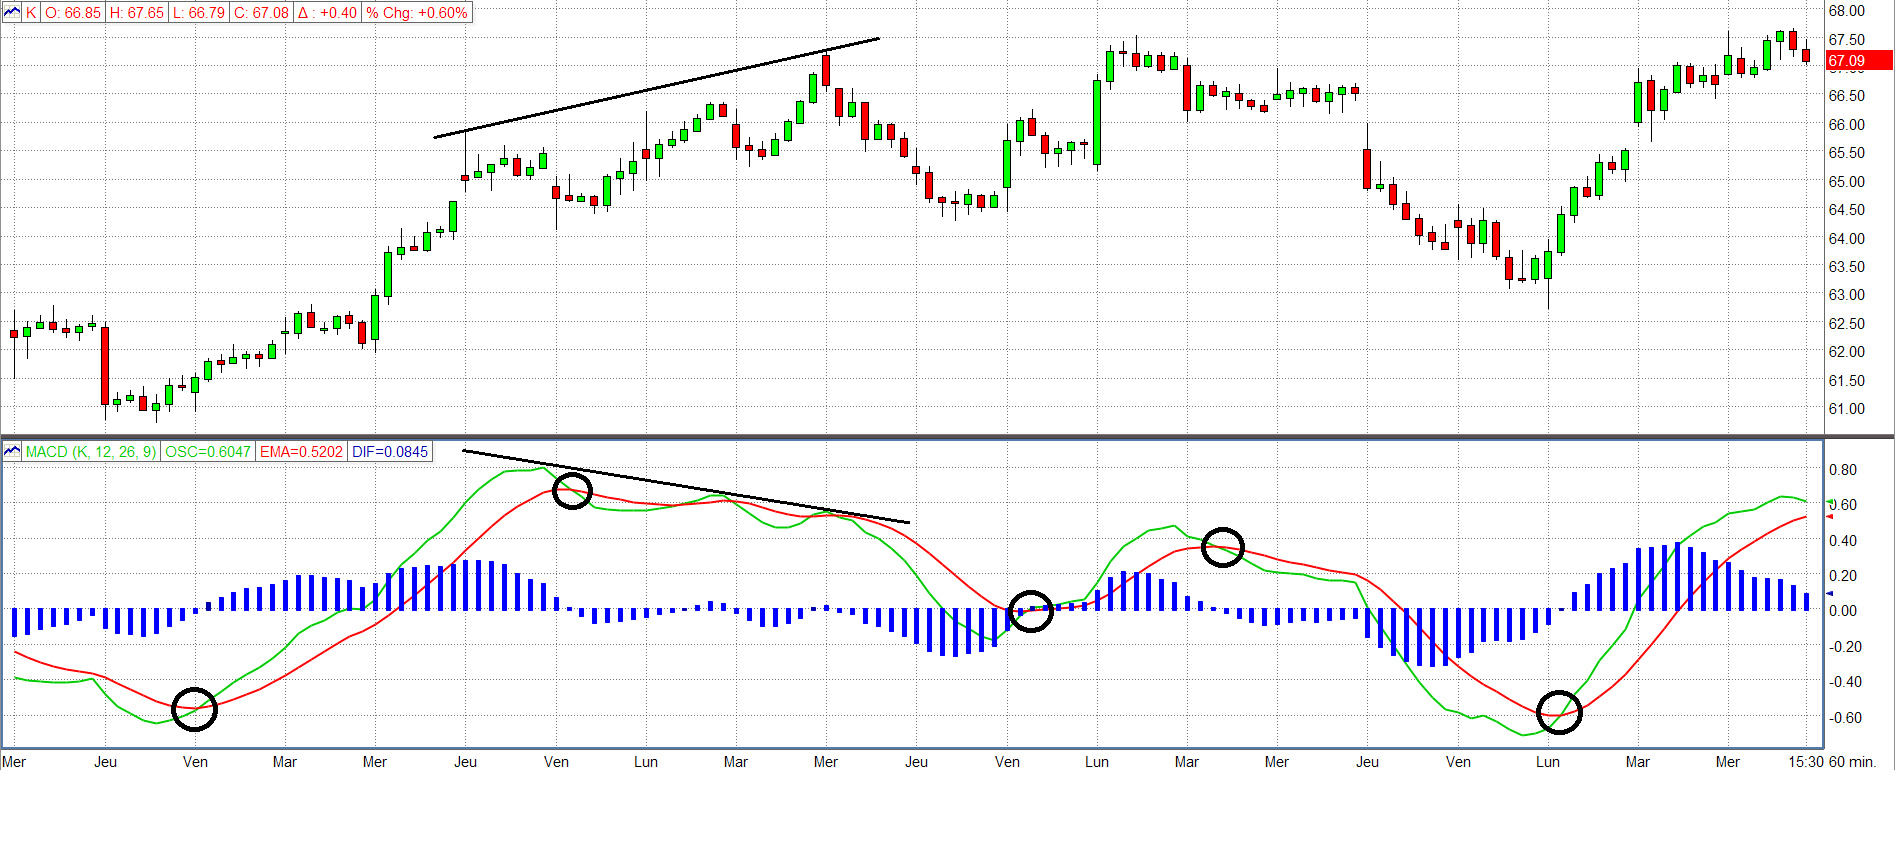
To spot a buy or sell signal with this indicator, you need to identify an intersection of the MACD line with the signal line. When the green line rises across the red line, it is considered a buy signal. Conversely, when the MACD line falls across the signal line, it is considered a sell signal.
Another important point to consider when studying this indicator is the difference between the MACD line and the signal line (amplitude). The farther apart the lines are from each other, the stronger the trend’s momentum is. Conversely, when the lines get closer together, it may signal a waning trend. The bar chart can therefore be used to view the strength of the current movement.
Divergence
In addition to looking for when lines intersect, you can also watch for what are called divergences. A divergence occurs when the share price and MACD line no longer follow the same trend. For example, the share price could continue to rise to new highs while the indicator shows highs that get progressively lower. Such a case represents a downward divergence and is interpreted as a sell signal.
Consult the image below to observe buy and sell signals sent by lines intersecting and an example of downward divergence.
*Source: Market-Q
Combination with the Relative Strength Index (RSI)
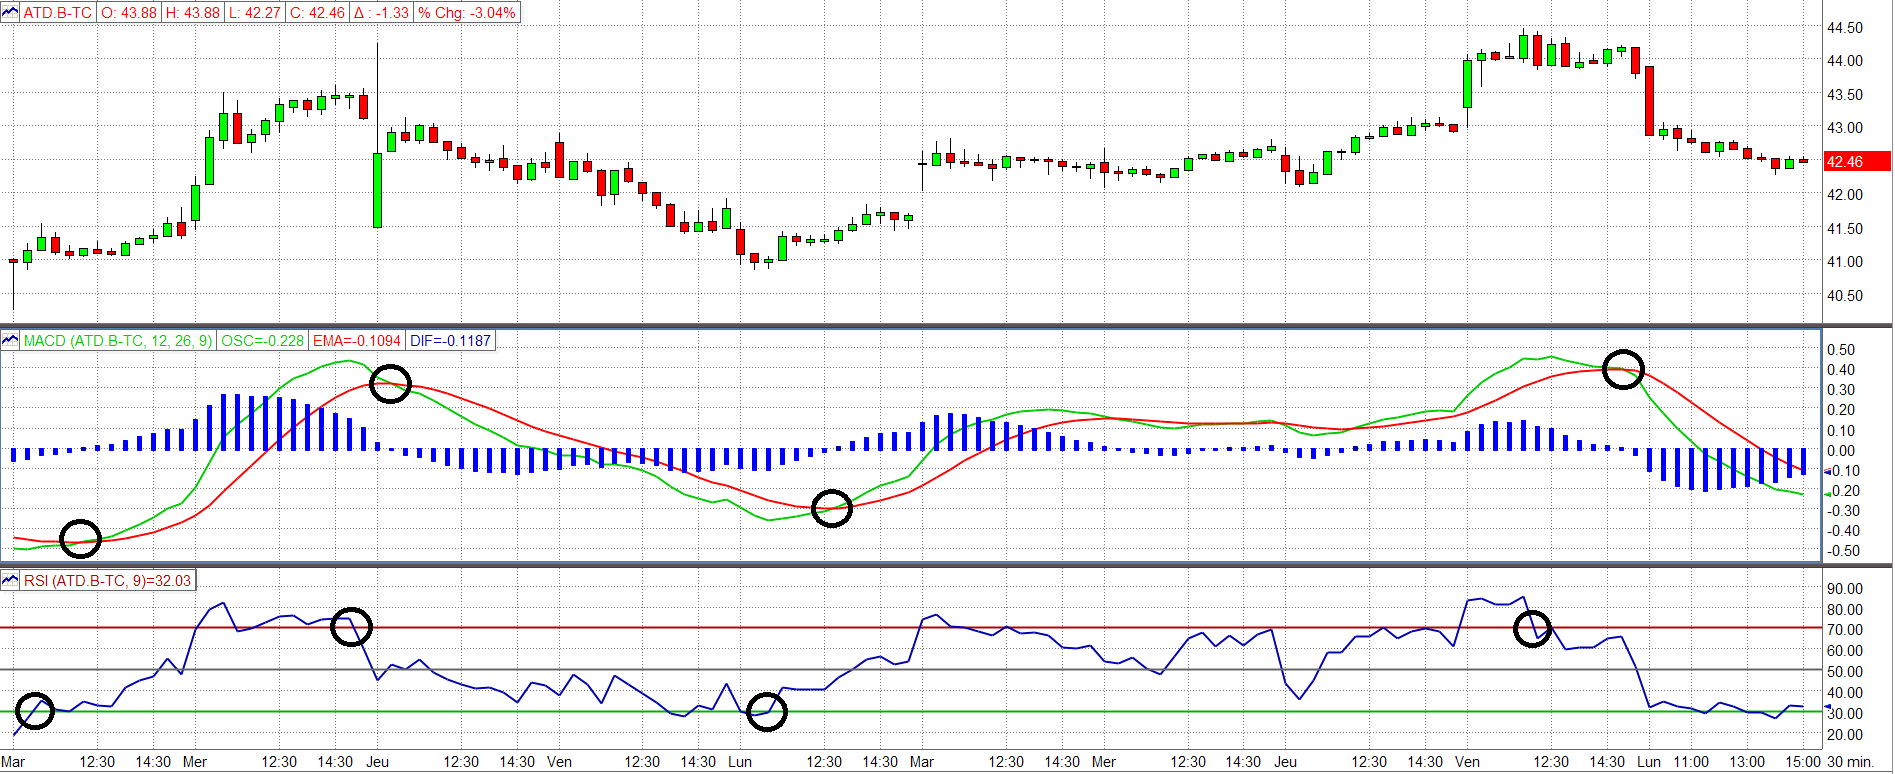
The relative strength index (RSI) and the MACD are both technical indicators that can be used to measure a trend’s momentum. Nevertheless, the method for calculating the MACD means that this indicator is better adapted for assessing the price of a stock when there is a strong trend. Investors can decide to combine the two indicators in order to obtain more than one buy or sell signal.
Let’s imagine an example where a share price was skyrocketing. On the one hand, the RSI can indicate that the stock is considered overbought as long as the rising trend persists. In contrast, the MACD indicator will allow you to better spot when a current trend is fading by measuring the difference between the MACD line and the signal line. You can therefore use the sell signals that these two technical indicators provide to decide the price at which you want to close your position or initiate a short sale.
As you can see with the following image, the relative strength index will generally give you buy and sell signals before the MACD.
*Source: Market-Q
Conclusion
Lastly, in the field of technical analysis, the MACD indicator is a tool often used by active traders because it allows them to better view changes in the momentum of a trend. Nevertheless, it is important to be aware that short-term transactions always involve a certain level of risk and are speculative in nature. Like all other technical indicators, the MACD is not infallible and it is strongly recommended to use it in combination with other analysis tools to confirm buy or sell signals.
Author biography: Alexandre Demers has been an active investor since 2013 and is the founder and president of Traders 360 Inc. He has also authored the e-book “Investir à contre-courant” (Investing against the grain) and hosts the “Finance 360” podcast available free on Spotify and iTunes. His goal is to make stock trading more democratic and educate the public at large about the possibilities of self-managed investing.
The above article was written by Traders 360, an external and independent partner of National Bank Direct Brokerage.