
Like technical analysis in general, chart patterns are visual representations of market psychology. In other words, they allow you to better observe the pressure that buyers/sellers exert on stock prices. The shape of each of these figures reflects investor behaviour and allows you to better predict the outcome of the battle between optimists and pessimists. Also, since chart patterns can be drawn over different periods, it is possible to use them both in a day trading context and for transactions over several days, or even a few weeks.
An important thing to know with regard to chart patterns is that they can be grouped into two main categories depending on what they predict:
- Continuation patterns: they indicate that the current trend should continue following a consolidation phase.
- Reversal patterns: they indicate a reversal of the current trend.
In order to illustrate how chart patterns are used within a graph, here are some classic patterns:
Ascending Triangle
The ascending triangle is a continuation pattern which indicates that the share price should continue its upward trend following a short consolidation period. This configuration consists of a horizontal resistance line and a diagonal support line.
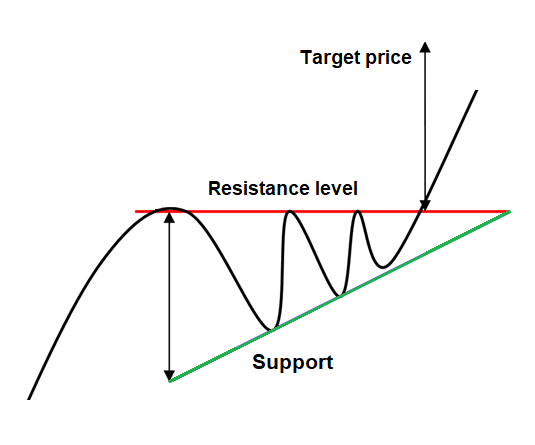
With rising troughs, the ascending triangle indicates increasing pressure on the side of buyers. In the end, when sellers give up, there is a break in the resistance level and an increase in the share price. For this pattern, the price target is calculated by measuring the range between the bottom of the triangle and the horizontal line.
Bull Flag
A bull flag is also a continuation pattern which indicates that the share price should resume its upward trend following a consolidation phase. This figure materializes with a sharp rise in the price (the flagpole) followed by a bearish corridor.
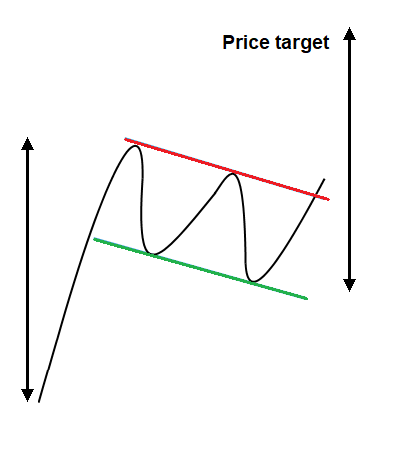
This movement reflects uncertainty from investors, and it is likely that some of them prefer to take their profits. It will therefore take renewed optimism and volume to break out from the resistance line of the bearish channel. For bull flags, the price target is calculated by measuring the height of the flagpole during the first surge.
Double Bottom
Double bottoms are a rather easy-to-spot reversal pattern. This configuration is drawn like a letter “W” and signals an upward trend reversal.
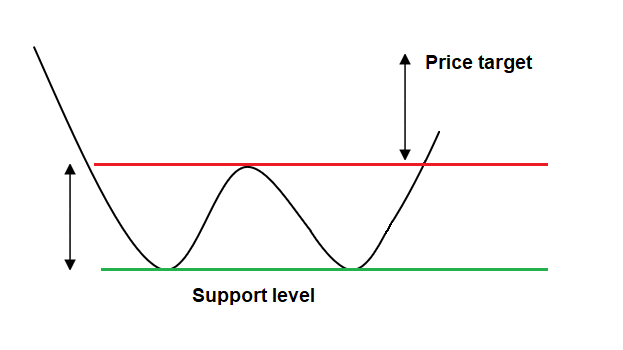
This figure indicates that a downtrend is running out of steam because the price can’t manage to break through the support level twice. If the share price manages to exceed the last peak, sellers capitulating will create an opportunity for an uptrend. To calculate the price target, simply measure the height of the corridor from peaks to troughs and establish a symmetry upwards.
Head and Shoulders
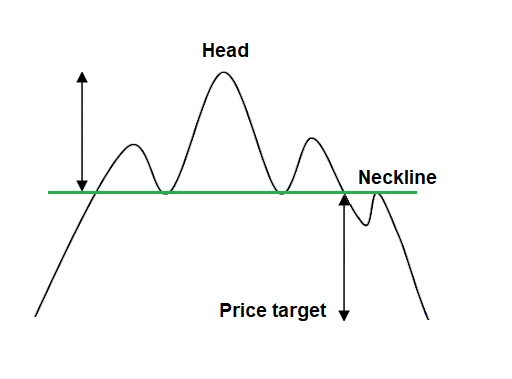
The head and shoulders is another reversal pattern that heralds a sharp turnaround in a bearish trend. It is characterized by three peaks, with the one in the centre (the head) always higher than the other two, and a support level (neck line) on which the price rebounds.
The head and shoulders is a representation of buyers’ inability to drive up the share price three times and underscores the strength of the pressure from sellers. To determine the price target with this pattern, you need to calculate the difference between the top of the head and the neck line and then adjust that distance downward, starting from the break in the support level.
Conclusion
Finally, you should know that there are many other chart patterns and it may be wise to learn them in order to be able to recognize them in a graph. In combination with other technical analysis tools, detecting these predefined configurations can allow you to identify very attractive buy or sell signals. Indeed, as you have seen, by spotting a pattern taking shape, you may be able to better anticipate the direction of the share price and also be able to set a price target. In conclusion, chart patterns provide you with additional information that can guide you in your investment decisions.
Author’s biography: Alexandre Demers has been an active investor since 2013 and is the founder and president of Traders 360 Inc. He has also authored the e-book “Investir à contre-courant” (Investing against the grain) and hosts the “Finance 360” podcast available free on Spotify and iTunes. His goal is to make stock trading more democratic and educate the public at large about the possibilities of self-managed investments.
The above article was written by Traders 360, an independent external firm partnered with National Bank Direct Brokerage.