

How does option strategy work? What are the terms to know while trading options? Learn all about the option basics here.
What is a covered call?
A covered call or covered call writing is a popular conservative option strategy used to generate income for investors. In this strategy, the investor sells (writes) one call option for every 100 shares of the underlying stock held in the portfolio. By selling the call option, the investor receives a payment from the buyer (premium). The covered call writer keeps this premium as income but from a tax perspective for most investors this income is treated as a capital gain. In exchange for this premium, the investor agrees to sell the underlying shares if they reach the exercise price (strike price) up until the expiration date of the call option.
As a result, the investor who wrote the call option and received the premium agrees not to benefit from any share price increase of the underlying stock above the strike price until its expiration.

Good to know! Investors can apply a covered call strategy in registered and non-registered accounts.
How does a covered call work?
The strategy requires the following:
- 100 share increments of a security that are option eligible
- One call option for every 100 shares of the underlying security
In this strategy, the shares are treated like a form of collateral in case they need to be sold if the call option is exercised by the buyer, hence the term covered call. Once the investor has the shares, they can select a strike price and expiration date from the option series and then sell the call option. By selling the call option (being short the call option), the investor receives a cash payment (premium) that they keep. The sold call option replaces the sell limit order that an investor would have placed on the shares.
If the price of the security hasn’t reached the strike price before expiration, the seller keeps the shares as well as the premium and can rinse and repeat using this strategy. The covered call writer can also close the option position by buying back the call option (type of operation: Closing buy) before maturity.
If the strike price is attained or surpassed by expiration, the investor would be obligated to sell the shares at the strike price (assigned). The proceeds from the sale would be deposited into the cash holdings of the brokerage account where the shares were held.
Why use a covered call strategy?
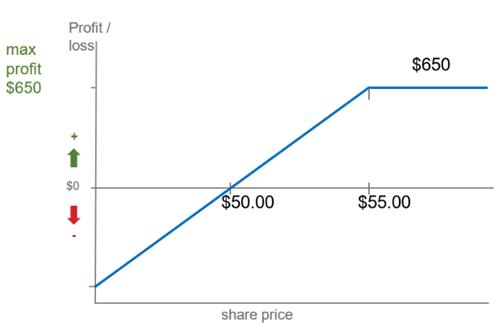
Investors have traditionally used a covered call strategy for three main reasons which we will discuss below. To illustrate an example will be provided for each scenario with the following information:
- Purchased 100 shares of ABC at $50
- One call option on ABC sold at a strike price of $55.00
- Received a premium of $1.50 (100 shares per option contract X 1.50 = $150)
- Share price appreciation capped at $5.00 per shares (100 shares X $5.00 = $500)
1. A covered call can bring additional income (yield enhancement)
Many investors will choose this strategy to increase the cashflow from their portfolio. They will sell covered calls on a regular basis (ex: with monthly or quarterly expirations) and pocket the premiums. This strategy can be applied on dividend paying securities which increases the potential cashflow beyond the dividend payment. In the case of non-dividend paying stocks, writing covered calls creates cashflow where none existed.
In this scenario, receiving the premium and keeping the shares in order to repeat the strategy is preferred. The covered call writer would prefer that the share price varies between $50 and $54.99 until expiration, and the max profit would be less than $650.00. The $650.00 would be a combination of the $150 of premium received and the remainder would be the share price increase.
If the investor believes the underlying security will not move much over the near term, then this strategy will appeal to them.
2. A covered call can allow the shares to be sold at a higher price
Using covered calls allows an investor to target a selling price that is higher than the current market price. In this version, the covered call writer would be happy to sell their shares at $55.00 but with the premium of $1.50, they receive that extra income which brings the selling price to $56.50.
In other words, the investor would like to sell their shares at $56.50 but isn’t sure if the shares will reach that price. By selling the covered call at a strike price of $55.00, the premium received brings the actual sale price to their desired price.
Many self-directed investors will use sell limit orders on their shares and wait until the price is reached. A covered call is very similar, except that they get paid even if the price doesn’t reach the limit price because of the premium.
3. A covered call can offer some downside protection if the stock declines
If one believes that the underlying price of a share will increase in value over the long term, but one expects a price decrease over the short term, a covered call can provide some downside protection.
Going back to our example, the premium received of $1.50 per share can also be subtracted from our $50.00 purchase of ABC and we now have a new break-even price. In this scenario, if the price of ABC shares doesn’t go below $48.50 the seller can come out ahead with this strategy.
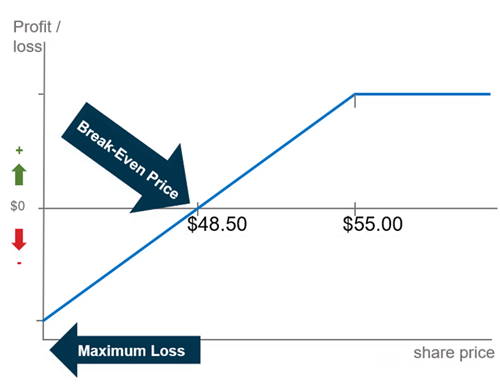
Looking at the chart, the protection is quite limited if the share price were to drop significantly. If the decline is expected to be larger the investors might purchase a put option to protect the value or sell the shares.
Factors affecting the covered call premium
When writing a covered call, the additional income one receives from the premium will be affected by the time value, the chosen strike price and volatility. Each of these have a role in determining the amount of premium collected.
- Time value: The longer the length of time before the call option expires the higher the premium. The reason is the longer term to maturity increases the likelihood of events (ex: earnings) that could cause the share price to increase.
- Strike Price: The option price will also be determined by where the current share price is to the option strike price. The closer the share price is to the strike price the higher the premium that the investor can earn but there is a higher probability of the option being exercised. When writing a covered call most investors will select a strike price higher than the actual current share price.
- Volatility: Represents the amount of risk or uncertainty related to the change in price of a security. The more a share price swings in a short period of time the higher the volatility. The higher the volatility of the underlying security the higher the premium on the option.
When to use a covered call strategy?
For additional income
- Market outlook:
- Short-term neutral to slightly bullish outlook. The investor expects the share price to remain flat or increase slightly.
- Long-term outlook remains bullish.
- A higher strike price increases the probability of the option expiring worthless and the investor keeps the shares.
- Avoid writing covered calls close to earnings release.
- Not good for a bullish to very bullish outlook because the share price could significantly increase, and the investor could miss out on the price increase.
Selling the shares at a higher price
- Market outlook:
- Short-term neutral to slightly bullish outlook.
- Share price
- Willing to sell the shares at a pre-determined price if the share price increases.
- A lower if neutral or higher if bullish strike price to increase probability of being exercised and selling the shares.
Downside protection
- Market outlook:
- Short-term neutral to slightly bearish outlook.
- Long-term outlook remains bullish.
- Share price
- Share price decline expected to be small.
- Not good if the decline is expected to be large or to be longer term. Consider selling the shares or purchasing a put option to protect the shares.
Pros and Cons of Covered Calls
| Pros | Cons |
|---|---|
| Can earn additional income from the shares an investor owns. | If the stock is bullish, one can limit the potential gains by being exercised. |
| Set a price to sell your shares and get paid for it (premium). | The investor can’t sell the shares while the covered call strategy is in place without buying back the options. |
| Get a limited amount of downside protection. | Every option call needs 100 shares of the underlying security. |
| This can be done in all types of brokerage accounts, unlike other option strategies that require a margin account. | For large share price declines a covered call strategy won’t help much. |
What tools can I use to find covered call ideas?
At National Bank Direct Brokerage, our clients have access to OptionsPlay, a free tool to help them select covered calls investment ideas among others. Investors can customize their preferred timeframe and risk tolerance and the tool will suggest a strike price and expiration for the covered call. OptionsPlay will calculate the Probability of Expiring Worthless (POW) with the chosen strike price on the call option. A higher number means less premium but a lower chance of the shares being exercised and vice versa.
Lastly, OptionsPlay will complete the transactional ticket when the investor selects the account and number of contracts to write.
Whether looking to generate some extra cashflow or provide some downside protection, with over 6000 option eligible securities listed on Canadian\US exchanges, investors have a wide choice of potential covered call opportunities. To validate your option level status with NBDB, please send a request via our message centre once signed in.
To open an account with NBDB click here or to add Covered Call Writing to your existing brokerage accounts, download the option trading request from our forms section and send the request to our message centre.